Google PageSpeed Insights Background
Google PageSpeed Insights (GPI) is a free tool that measures how well your page is technically optimized. Your score results from running your domain through Lighthouse, Google’s open-source, automated tool for improving your website.
Like GTmetrix, once you get your GPI score, you can also follow a series of steps to improve your score. Unlike GTmetrix, GPI doesn’t focus on how quickly your website loads or what it’s like to experience a website loading, which means that you can’t spot bottlenecks as they may occur in real-time (read our GTmetrix review and case study here).
With these important differences in mind, let’s dig deeper into GPI and appreciate what it has to offer.
Google PageSpeed Insights Features

Once you enter your URL, you’ll get your performance results in moments. You can also toggle between viewing your website’s results for a mobile device or desktop device.

The first thing you’ll see is your GPI score.

It’s important to optimize for both desktop and mobile because the two can be radically different. The above is for mobile while the below is for desktop.

GPI uses an easy to read color-coded system.
Field Data
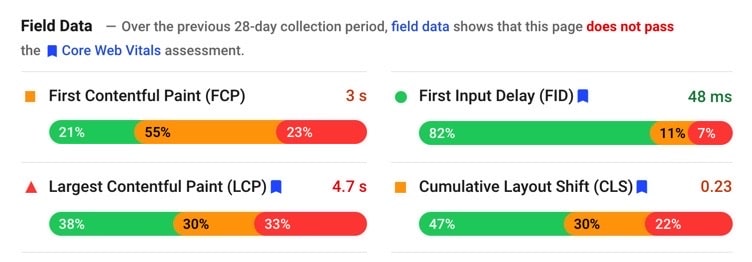
Your first batch of data comes from Google’s Core Web Vitals, a set of benchmarks prioritized by Google. Also known as real user monitoring (RUM), this data comes from real page loads.
- First Contentful Paint (FCP): This is the measure of how much time passes until the first big visual element appears to your visitors.
- First Input Delay (FID): This is the measure of how long until your page is interactive.
- Largest Contentful Paint (LCP): This is the measure of how much time passes until your page’s main content becomes visible.
- Cumulative Layout Shift (CLS): This is the measure of what Google calls “visual stability,” which means that the page doesn’t experience any noticeable visual changes.
To the right of the Field Data, you’ll see a preview of your website as it appears on a desktop or mobile device.
Origin Summary
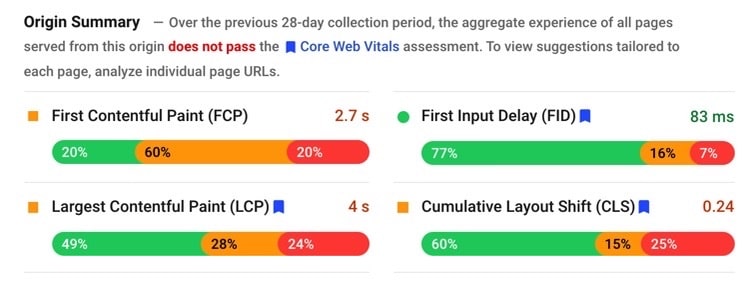
This is an average of the FCP, FID, LCP, and CLS for all the pages on your website.
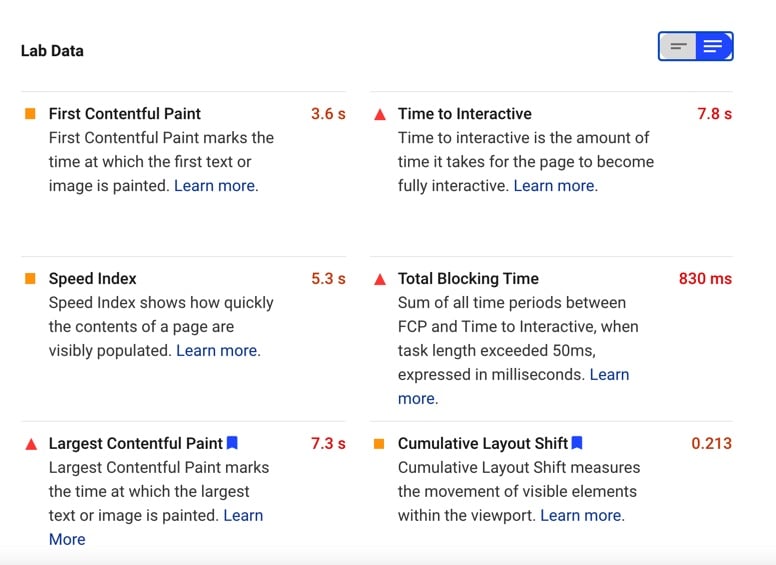
Lab Data
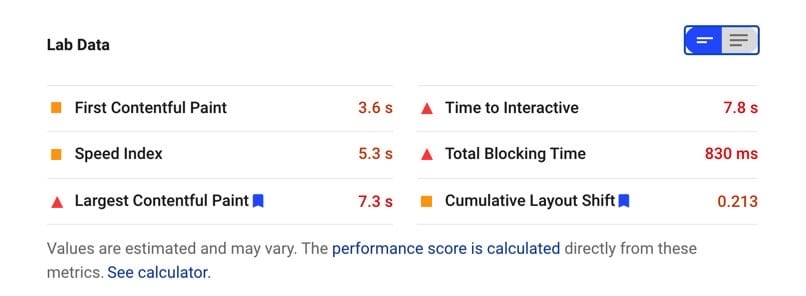
Lab is short for “laboratory” because this data is arrived at by using an algorithm in a controlled environment (much like a lab). Unlike field data, this data could miss real-world issues, so it’s useful to have both lab and field data.
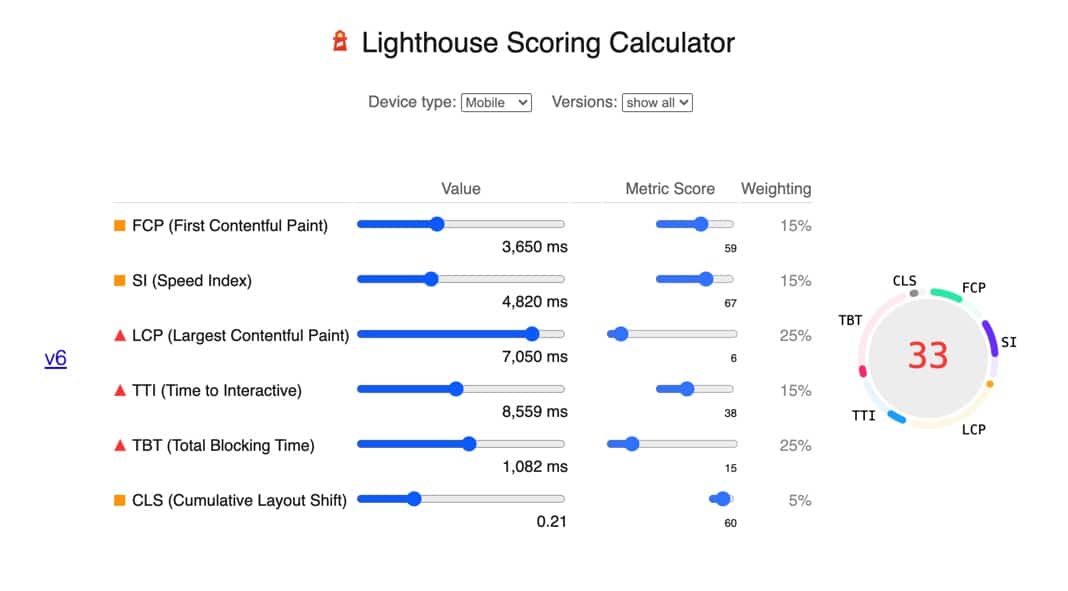
- Speed Index (SI): SI is the measure of how quickly your page fills with content as it loads.
- Time to Interactive (TTI): TTI is the measure of how long it takes for your page to be 100% interactive.
- Total Blocking Time (TBT): TBT is the measure of how much time passes between the first text or image appearing (FCP) and when the page is completely interactive (TTI).
You can toggle the view of lab data so that you get an explanation of what each metric measures.
The images beneath the lab data are a visualization of your website as it loads.

Since PSI lets you toggle between testing your website on a desktop or mobile device, the visualizations reflect your selection.

When you click on the blue “see calculator” text in the Lab Data, you can control the Lighthouse scoring calculator settings. The score will adjust in real-time.
Opportunities
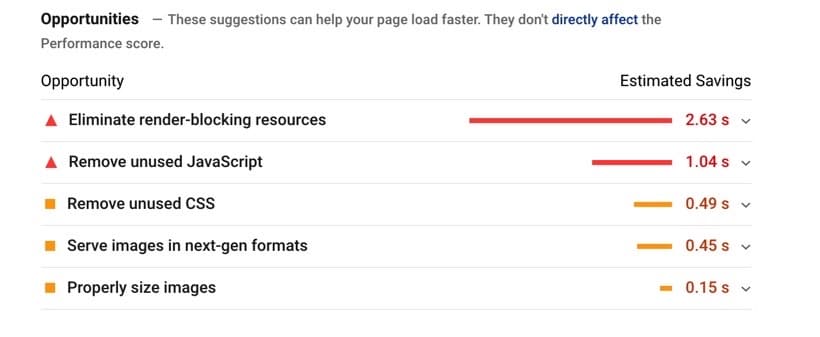
This is the section where PSI gives you actionable steps to improve your website.
Diagnostics
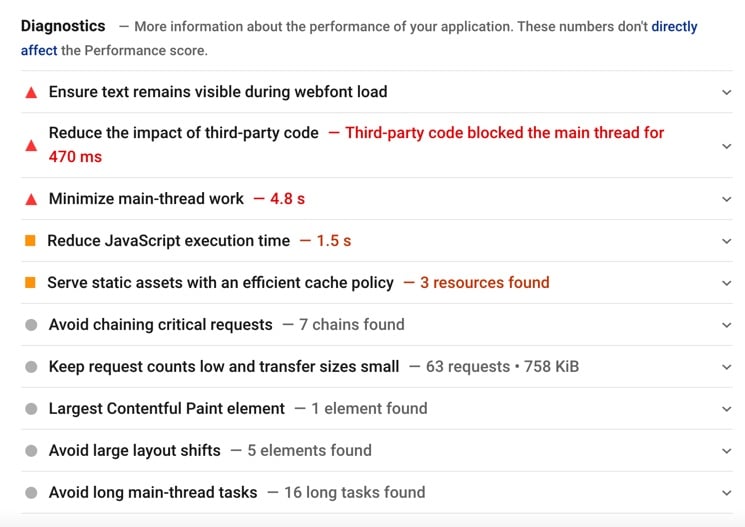
Diagnostics are best practices that you should follow that don’t necessarily impact your performance score.
Passed Audits
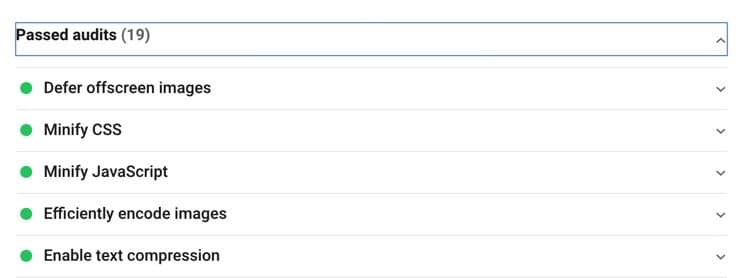
Passed audits is a dropdown menu that shows you all the benchmarks that your page has already met.
How Google PageSpeed Insights is Used
PSI is intuitive and easy to use. After you run your domain through the analyzer, you scroll down to see all the data and recommendations. Many of the sections feature drop-down menus that explain what the metric measures. Google also offers extensive documentation.
Google PageSpeed Insights Use Cases
Quick Diagnostics
Google PageSpeed Insights are color-coded, easy to read, and limited in number, making them ideal for presenting to clients who may have limited technical knowledge. While remedying the issues GPI introduces takes technical know-how, “Time to Interactive 9.1 S” is straight forward and easy to understand!
Mobile Page Speed
The importance of mobile page speed cannot be overstated. Literally, if your website isn’t optimized for mobile, it will not rank well on Google. For this reason, easy to parse suggestions for improvement are indispensable.
A Google Centric Approach
Since GPI is Google itself telling you what metrics are important, you can prioritize getting a good score. Just remember that a good PageSpeed score isn’t the same as an ideal user experience. With that distinction in mind, you can create a website with a good GPI score and a positive UX.
Google PageSpeed Insights Pricing
Free!
Bottom Line on the Google PageSpeed Insights
![]()
Google PageSpeed Insights is free, efficient, and intuitive. It doesn’t, however, offer as many metrics or features as GTMetrix. GPI doesn’t offer page speed monitoring, which is indispensable given how important page speed is. GPI also doesn’t measure the experience of what it’s like for someone to experience your website. As a result, you may end up missing the real-world bottlenecks that GTMetrix documents using features like video or waterfall charts. Finally, GPI also doesn’t let you control the location of where your tests are run.
Nonetheless, GPI is useful when used to map out your plan of attack for doing SEO. Just remember that GPI isn’t the end all be all, and Google PageSpeed Insights will serve you well.